How to get a job as a data engineer (part 2)
Part 1 of this series, showed the steps to becoming a Data Engineer. In part 2, I want to help you identify the areas in your data engineering career path that you should focus on. In part one, you should have gotten a feel for what’s required to be a Data Engineer.
The Revised Skills Diagram
Thank you, Paul Brabben, for pointing out an omission in the previous diagram. Here is the updated version.
Notice the inclusion of security? Security is a discipline unto itself, and as data engineers, our work significantly impacts a company’s security posture. It’s easy to become overly preachy about security without actually benefiting anyone. Effective data security practices almost always involve collaboration.
If you are a data engineer tasked with delivering an end-to-end data product, consider these essential questions:
- Who is in charge of security?
- Is there a SecOps department?
- How soon can I meet with them?
- Does the company have established patterns for deploying curated data products?
- What acts and policies must the data comply with?
- How do I identify and handle sensitive data, such as PII?
Asking these questions ensures that security is integrated into your workflow, helping to protect the data and the company.
The Skills Survey
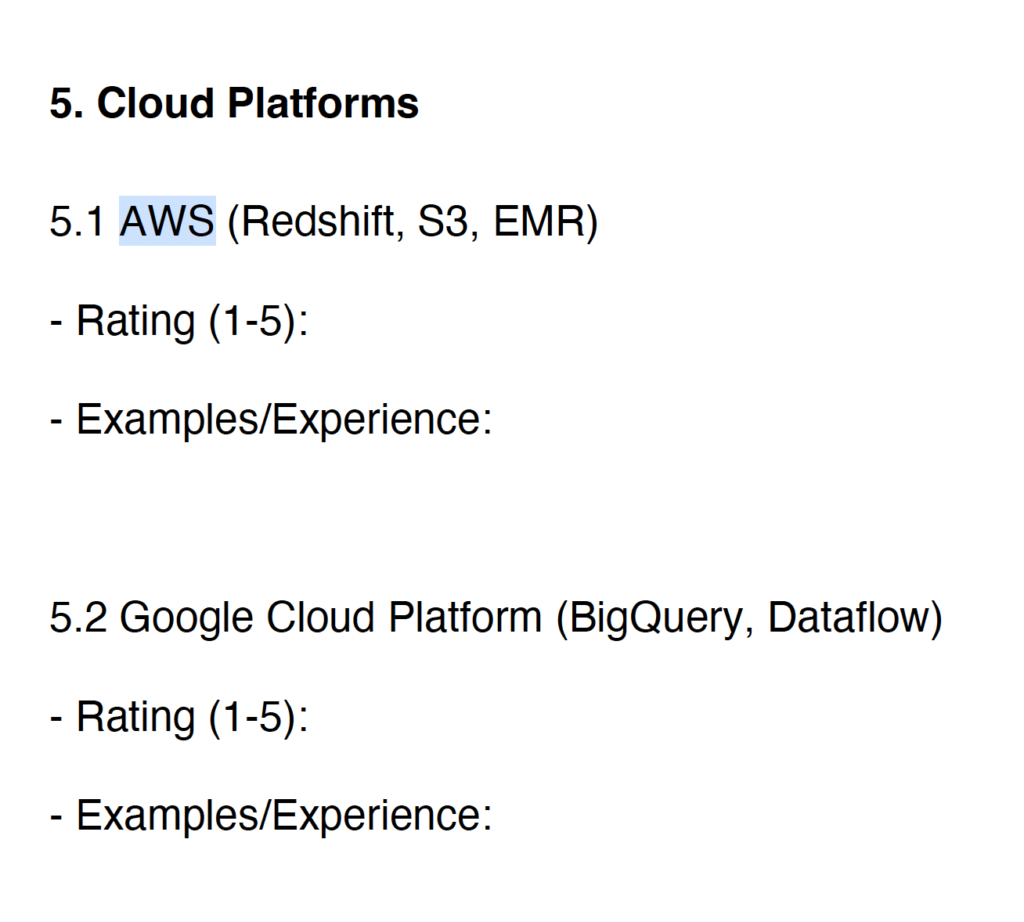
A survey is a valuable tool to identify areas that need attention. Being honest with yourself is key. I’ve created the self-assessment below, with the help of Chat-GPT.
Data_Engineering_Skills_Assessment_SurveyIf you take time to complete it, you’ll better understand which areas of a data engineer’s skillset you need to work on.
Example – AWS
Let’s take AWS as an example. If you don’t know what AWS is or haven’t worked with it, rate yourself as No Experience – 1. Avoid overestimating your skills. For instance, if you rate yourself as Intermediate in AWS but haven’t thoroughly studied it, you might struggle to explain concepts like AWS Lambda in an interview.

Using a Radar Chart
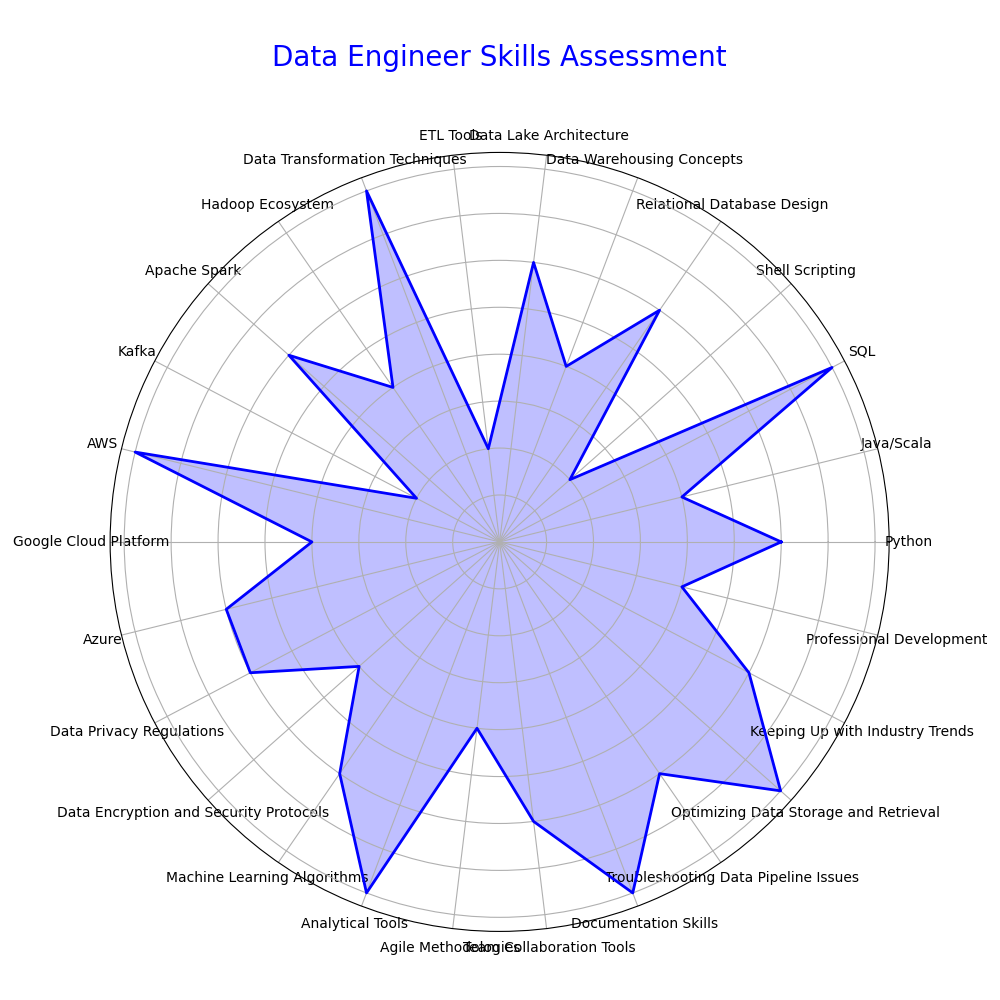
You can use the survey results to create a current skill set radar chart. Here’s an example:

This visual representation helps you see your strengths and areas for improvement, guiding your upskilling efforts effectively.
Here’s the code to generate your own skills assessment survey’
import matplotlib.pyplot as plt
import numpy as np

# Sample survey responses with updated skills
survey_responses = {
    'Python': 3,  # Intermediate
    'Java/Scala': 2,  # Beginner
    'SQL': 4,  # Advanced
    'Shell Scripting': 1,  # No Experience
    'Relational Database Design': 3,  # Intermediate
    'Data Warehousing Concepts': 2,  # Beginner
    'Data Lake Architecture': 3,  # Intermediate
    'ETL Tools': 1,  # No Experience
    'Data Transformation Techniques': 4,  # Advanced
    'Hadoop Ecosystem': 2,  # Beginner
    'Apache Spark': 3,  # Intermediate
    'Kafka': 1,  # No Experience
    'AWS': 4,  # Advanced
    'Google Cloud Platform': 2,  # Beginner
    'Azure': 3,  # Intermediate
    'Data Privacy Regulations': 3,  # Intermediate
    'Data Encryption and Security Protocols': 2,  # Beginner
    'Machine Learning Algorithms': 3,  # Intermediate
    'Analytical Tools': 4,  # Advanced
    'Agile Methodologies': 2,  # Beginner
    'Team Collaboration Tools': 3,  # Intermediate
    'Documentation Skills': 4,  # Advanced
    'Troubleshooting Data Pipeline Issues': 3,  # Intermediate
    'Optimizing Data Storage and Retrieval': 4,  # Advanced
    'Keeping Up with Industry Trends': 3,  # Intermediate
    'Professional Development': 2  # Beginner
}

# List of skills
labels = list(survey_responses.keys())
num_vars = len(labels)

# Compute angle for each axis
angles = np.linspace(0, 2 * np.pi, num_vars, endpoint=False).tolist()

# The plot is a circle, so we need to "complete the loop"
# and append the start to the end.
values = list(survey_responses.values())
values += values[:1]
angles += angles[:1]

# Setup the radar chart
fig, ax = plt.subplots(figsize=(10, 10), subplot_kw=dict(polar=True))

# Draw the outline of the spider diagram
ax.fill(angles, values, color='blue', alpha=0.25)
ax.plot(angles, values, color='blue', linewidth=2)

# Draw one axe per variable and add labels
ax.set_yticklabels([])
ax.set_xticks(angles[:-1])
ax.set_xticklabels(labels)

# Show the radar chart
plt.title('Data Engineer Skills Assessment', size=20, color='blue', y=1.1)
plt.show()
You can easily run it on tools like Python Fiddle
Where to From Here?
After completing your skills survey and chart, it’s time to plan how to fill your gaps.
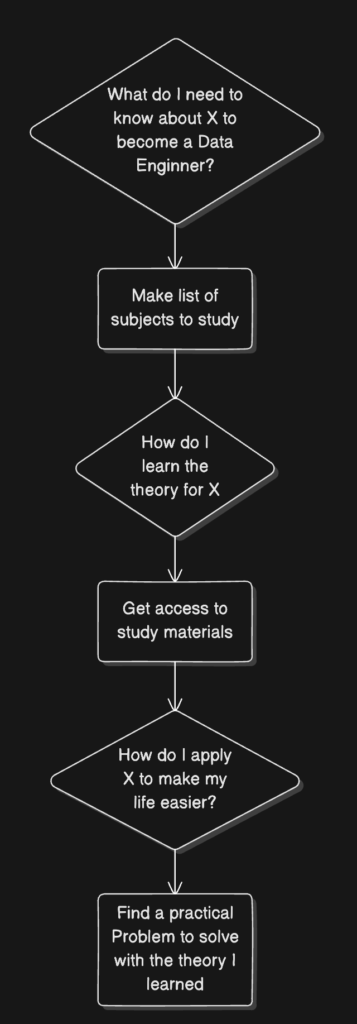
Here’s a flow diagram for the steps you need to follow:

Let’s use AWS as an example.
What do I need to know about AWS to become a Data Engineer?
AWS has a certification program, called AWS Certified Data Engineer Associate. It’s not the shortest name for a certification, but it’s valuable to investigate. The site provides you with the following steps
The site has the resources needed to answer the first question.
Make a list of subjects to study
To learn AWS, the Exam Guide is a good resource.
AWS-Certified-Data-Engineer-Associate_Exam-Guide-2Reading the exam guide will give you a feel for familiar and foreign subjects. Let’s use :
Batch data ingestion (for example, scheduled ingestion, event-driven ingestion)
How do I learn the theory of Batch Data Ingestion?
Search for AWS Batch Data Ingestion and you’ll find documentation on AWS’s site. I’ve used Glue in the past. Here’s an example of the architecture on the site:

How do I apply data ingestion (and AWS Glue) to make my life easier?
The classic example is to use Glue to ingest CSV files into another data store, such as Redshift. Here is the complete Chat-GPT description. Look at the Python code it generated:
import sys
from awsglue.transforms import *
from awsglue.utils import getResolvedOptions
import boto3
from pyspark.context import SparkContext
from awsglue.context import GlueContext
from awsglue.job import Job

# Initialize contexts and job
args = getResolvedOptions(sys.argv, ['JOB_NAME'])
sc = SparkContext()
glueContext = GlueContext(sc)
spark = glueContext.spark_session
job = Job(glueContext)
job.init(args['JOB_NAME'], args)

# Load data from S3 (purchase data)
s3_datasource = glueContext.create_dynamic_frame.from_catalog(database = "customer_data_db", table_name = "s3_purchases")

# Load data from MySQL (customer details)
mysql_datasource = glueContext.create_dynamic_frame.from_catalog(database = "customer_data_db", table_name = "mysql_customers")

# Perform transformations (join the data)
joined_data = Join.apply(s3_datasource, mysql_datasource, 'customer_id', 'customer_id')

# Load data into Amazon Redshift
redshift_sink = glueContext.write_dynamic_frame.from_catalog(
    frame = joined_data,
    database = "redshift_db",
    table_name = "public.customer_insights",
    redshift_tmp_dir = "s3://aws-glue-temporary/"
)

# Commit job
job.commit()
Make sure you understand every line. If there’s a line that you don’t understand, look it up and learn it. You’re well on your way to becoming a Data Engineer.
Find a practical problem to solve with your newfound knowledge
See this as your homework. If you just learned how to handle CSV files, understand what to do the next time you hear people talking about spreadsheets or CSVs that won’t fit in Excel.
Applying what I’ve learned in any possible way has helped cement the fundamentals of Data Engineering in my career. I’d be surprised if the same doesn’t apply to you.
Summary
One of the secrets of becoming a modern and complete Data Engineer is to be methodical about learning new skills. I’ve shown you what’s worked for me. This approach will work for you too.
Learn how to become a Data Engineer by subscribing to my mailing list:
No spamming, just quality content
